Mozilla Foundation organization representation, 2022 data
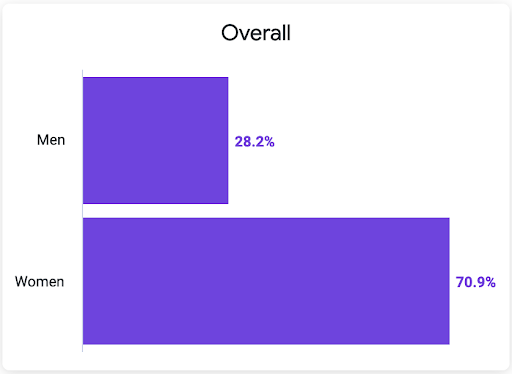
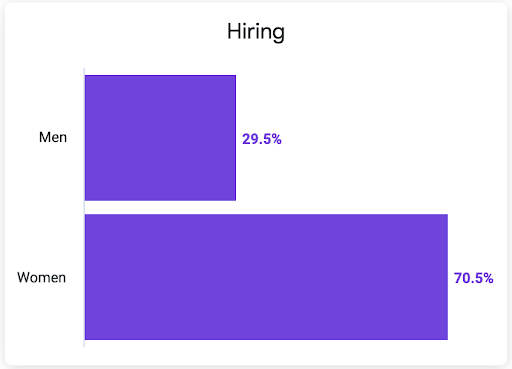
Gender
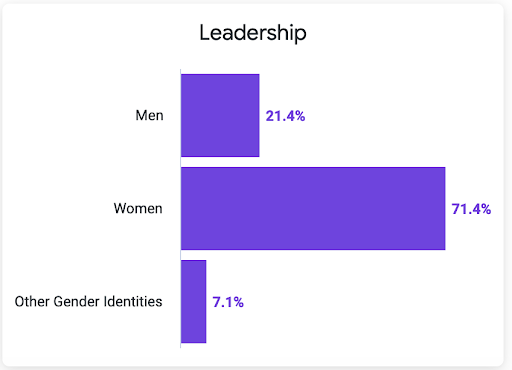
Women made up more than 70% of the Mozilla Foundation employee base. The directors and executive team were primarily composed of women, with 71.4% of leadership roles staffed by women, up nearly 10 percentage points from 2021.
Race and ethnicity (U.S. only)
We focused our efforts on attracting and retaining talent amongst a spectrum of communities and made demonstrable progress, recognizing there is much more room for continued growth. We saw a 6.4 percent increase in Black/African American representation in 2022, and a 4.3 percent increase in Asian employee representation from 2021. We also saw a 14.3 percent increase in representation at the leadership level (director+) from Asian, Black/African American, and Two or More Races groups.


Intersection of gender, race, and ethnicity (U.S. only)
White women represented 43.6% of the Mozilla Foundation’s staff in the United States. Women of color — those who are Black/African American, Asian and Hispanic/Latinx — represented over 18 percent of the organization. We additionally saw a 7-point increase in Black/African American women staff from 2021.

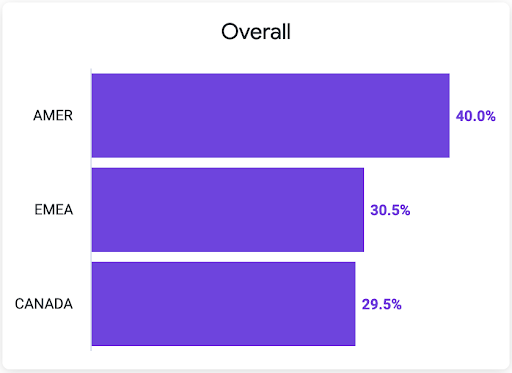
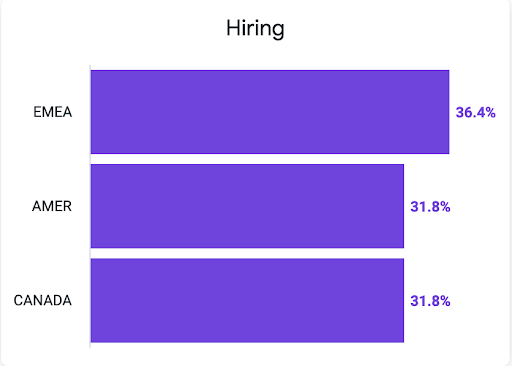
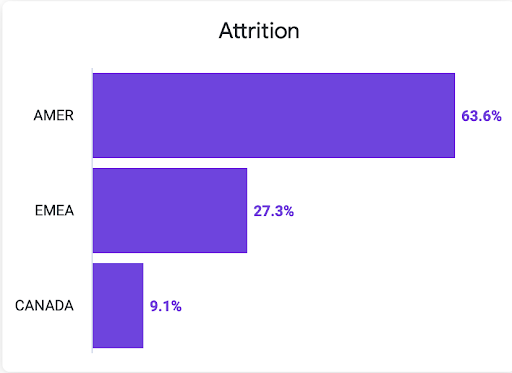
Region
Around 40% of the Mozilla Foundation’s staff were regionally located throughout parts of AMER (United States, South America, & Central America), with the remaining staff split between Canada, Europe and parts of the African continent. U.S. staff represented 31.8% of hires and 63.6% of departures while staff based in the EMEA (Europe, Middle East and Africa) region represented 36.4% of hires and 27.3% of departures in 2022.
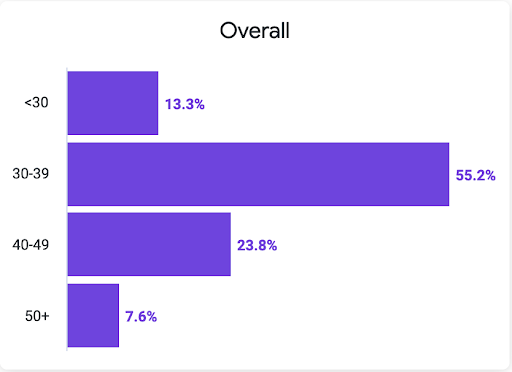
Age
31.4% of staff at the Mozilla Foundation are at or over the age of 40, down nearly eight percentage points from the prior year. The median age of our staff at Mozilla Foundation is 35 years old, down 3 years from our previous disclosure.
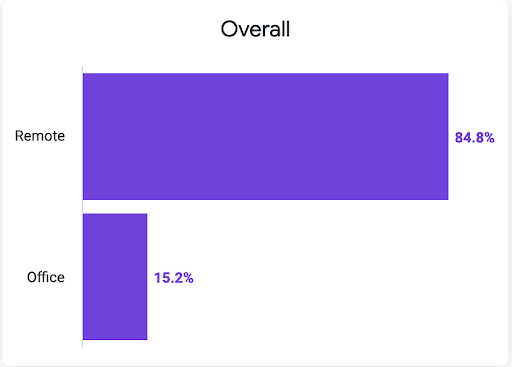
Working location
Mozilla has continued to embrace remote working over the years, and our remote work culture has remained strong. In 2022, over 84% of our employees at Mozilla Foundation identified as remote workers (up from 74% at the end of 2021, 53% in 2020, and 47% in 2019).
Methodology
- All diversity data are self-reported and come from the Mozilla Corporation and Foundation’s human resources information system for regular employees as of December 31, 2022. Progress over 12 months is compared against December 31, 2021.
- Staff at the Mozilla Corporation includes only regular, full-time employees. Staff at the Mozilla Foundation includes regular, full-time employees and fixed-term employees, as some fixed-term staff are tied to grants or specific funding sources.
- Currently, fewer than 1% of Mozilla Corporation employees select “other gender identities.” We recognize that gender identities exist on a spectrum.
- In order to be in compliance with global laws, we do not track race and ethnicity outside of the United States at this time. All race and ethnicity data are for employees in the United States only, and categories are driven by United States government requirements for disclosure.
- Leadership representation excludes executive-ranked technical fellows and only includes all levels of directors, vice presidents and the executive team.
- Technical workers are defined as staff working on our products and within IT.
- Only voluntary departures are included in attrition calculations.
- Employees who opted to decline to provide demographic data are not included in the metrics provided.
- Some categories may not add up to 100% if fields were left blank or listed as “other.”
- In the event of comparison to historical reports: Any differences in values of historical data are due to data corrections and/or updates (e.g. if an employee made a change to their demographic information, we are using their most recent data for all past years).